In this post I’ll show how I have tried to capture sound on the Arduino and make some simple frequency analysis on it. The possible applications are several, like having a LED tone visualizer as the one shown here, but my specific purpose is to synchronize a light with some music, particularly on the low frequencies. While mounting the system I have explored different possibilities and I have written what I have discovered in this post.
The circuit
for the circuit you need a microphone and an amplifier to put the voltage range into 0-5V as required by the ADC of Arduino.
Now ideally what you want is something that should give values form 0 (no sound) to 1024 (maximum detectable sound) and should add no noise, but in reality what you can get is that the mean measured value at the ADC is around 500 (the sound is a wave by definition so you have to move its center value between 0 and 5V = 2.5v), the circuit will add some noise, and is not always easy to have the full range of values (that is from 0 to 5V or 0 to 1024 at the ADC).
I have done experiments with three alternatives:
Alternative 1: opamp amplifier
As I wanted a cheap and dirty approach I decided to use common opamps. The drawback is that these often are not used for audio applications, and the quality of sound and (especially) the level of noise can be horrible !
The schematics I have used is exactly the same as on this page a part the fact that I have used a single UA741 amplifier instead of the LM358. You can find other similar circuits on the web like this one and this one. The microphone I am using is a standard electret microphone like this one.

Sound amplifier with opamp (taken from here)
I have connected the output to my headphones and it works, you can actually hear the sound of the microphone amplified, but… you hear a lot of noise too. The reasons for this noise can be multiple: the electromagnetic interference flowing into my un-shielded, long wired prototype, the opamp that is not designed for audio applications and others I am not even aware of.
Now let’s plug the circuit to the ADC of the Arduino and let’s see what values I receive.
I have made a similar analysis as the one done by Dimitar in his post. Actually I have used his same sketch that computes minimum and maximum peaks plus the peak to peak difference for 10000 samples (about 1 second).
I have tested four values of R5 resistance:
| R5 | Almost silence | Talk | Strong sound |
| 10K | range: 4 AVG: 509 | range: 23 AVG: 507 | range: 208 AVG: 509 |
| 56K | range: 17 AVG: 508 | range: 35 AVG: 510 | range: 525 AVG: 510 |
| 100K | range: 30 AVG: 510 | range: 68 AVG: 509 | range: 533 AVG: 508 |
| 150K | range: 41 AVG: 509 | range: 109 AVG: 509 | range: 537 AVG: 507 |
You can see that the differences between the range at high volume and the range at silence are 204, 508, 503, 496 which leads us to say that the 56K resistance is the one that optimizes the dynamic range (a very similar conclusion to the one given by Dimitar in his post).
You can also see that the, being the average value at around 510 the maximum and minimum sampled values can be around 240 and 780, which means that the circuit is not able to output the full 0-5 V range, even with a high gain. Actually the 150K adds very little to the range, meaning that we have already reached the saturation of the circuit (it was also possible to see it with headphones).
So let’s fix the resistance to 56K and let’s do some of the frequency response of the circuit. For this I have used the very nice free TrueRTA program. I connected the audio output (the headphones jack) to the input of the amplifier circuit and the output of the circuit to the audio input (the microphone jack) of the computer.
This is what happens if no signal is given as input to the amplifier (that is no sound emitted from the computer):
-

- Raw noise signal
-

- Noise spectrum
You can see that there is a lot of noise at almost all frequencies and that the noise is even saturated (probably because the signal is too big for the microphone input of the computer).
Now let’s produce some white noise at half of my computer volume and analyze the amplified signal in my audio input:

Response to white noise of the opamp audio amplifier
you can clearly see that the circuit behaves as a high pass filter with attenuation at low frequencies.
Now let’s see the response at 100Hz, 1000Hz and 10000Hz:
-

- 100Hz
-

- 1KHz
-

- 10KHz
You can clearly see the peak at the corresponding frequency in the three cases of a gain of about 10db from the noise level. You can also see some harmonics generated by the saturation pretty clear. In fact, plotting a sine signal at 500Hz, at half of the computer volume you get:

Signal at 500Hz taken at the computer audio input
which shows very clearly that the signal is saturated. Now this saturation can be introduced by the amplification circuit itself, or it can also be introduced by audio input of the computer which is designed for microphones, that is, low currents.
Alternative 2: transitor amplifier
The Arduino Basic Connections manual has a page where it shows how to use a microphone with Arduino. I have mounted it but with a different transistor I had at home, the BC337 which seemed to me similar to the one recommended in the card, a 2N222. I have used my electret microphone, but the sound was hardly hearable in the headphones, only tapping the mic was recognizable. Maybe the circuit in the card is for stronger microphones? I don’t know.
Alternative 3: Sparkfun’s electret kit
I have also ordered the sparkfun electret microphone kit.
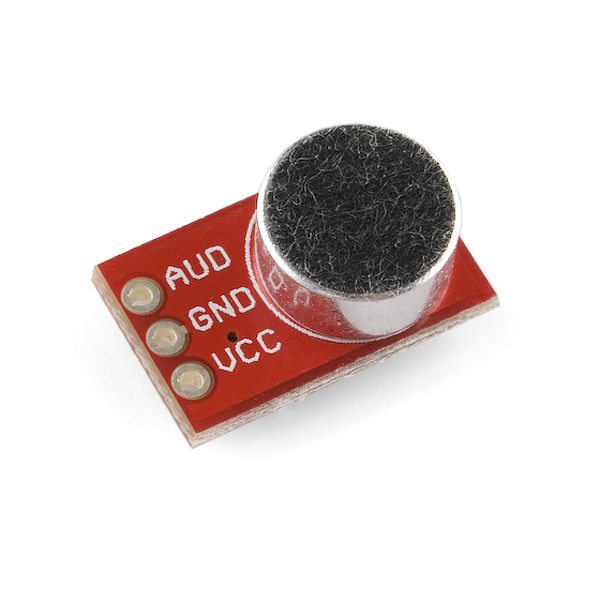
Sparkfun’s breakout board for electret microphone
I have connected the Vcc pin to the +5V of the Arduino and connected the GND and AUD pins to the audio input of my computer. Looking at signal generated by the microphone in almost silence we can see, on the computer:
-

- noise signal
-

- noise spectrum
you can see that there is already some noise, and that it is also saturated (though the amplification gain in the computer is set to its minimum).
Using some headphones and pushing with white noise in them:

White noise response of Sparkfun’s kit
you see a band-pass behavior, but we can never guess exactly what filters what as we have the headphones, the microphone, the amplification circuit and the computer’s input in a chain.
Now let’s analyse the range dynamics with Arduino:
| Almost silence | Talk | Strong sound |
| range: 745 AVG: 512 | range: 839 AVG: 508 | range: 1023 AVG: 513 |
That proves that the circuit exploits the full range 0-5V completely, although it might amplify the signal quite strongly if compared to the opamp circuit whose range in almost silence was much smaller.
The audio analysis algorithm
Analog processing
You can always use analog filters to detect the signal’s spectrum in a set of possible bands. A common integrated circuit used in several projects is the MSEGQ7 which is able to give you the peak of the signal in 7 different bands around the following frequencies: 63Hz, 160Hz, 400Hz, 1kHz, 2.5kHz, 6.25kHz and 16kH. There is a good tutorial here, in this case you don’t need to do signal processing, nor you need to worry about sampling frequency and other stuff, you have the value of the peak right in your analog input 😉
Digital processing
In this case you have to address two separate problems here: sampling the signal and analyzing it in the frequency domain.
Sampling
A serious approach to audio analysis in Arduino would need increasing the sampling rate of the Arduino ADC. My Arduino Diecimila normally samples at about 10KHz (depending on the code you have in the middle, in theory it should be 9615).
It is also possible to sample at higher frequencies setting the ADC prescaler in a different way. With this trick you can reach 77KHz of sampling rate on ATMega168 without significant loss of quality. This page, this page and this other one explain the concept well.
Here are two examples of how to set the prescaler:
#ifndef cbi
#define cbi(sfr, bit) (_SFR_BYTE(sfr) &= ~_BV(bit))
#endif
#ifndef sbi
#define sbi(sfr, bit) (_SFR_BYTE(sfr) |= _BV(bit))
#endif

//example 1: Set prescaler to 16 (= 77MHz) (1-0-0)
sbi(ADCSRA,ADPS2) ; //Sets ADPS2 to 1
cbi(ADCSRA,ADPS1) ; //Sets ADPS1 to 0
cbi(ADCSRA,ADPS0) ; //Sets ADPS0 to 0

//example2: Set prescaler to 64 (= 19KHz) (1-1-0)
sbi(ADCSRA, ADPS2);
sbi(ADCSRA, ADPS1);
cbi(ADCSRA, ADPS0);
According to this post the actual sampling frequencies are a little bit lower than the theoretic ones declared by ATMel in this order:
Prescaler Actual maximum sampling frequency
16 62.5 kHz
32 33.2 kHz
64 17.8 kHz
128 8.9 kHz
I have also made my tests and with the standard settings of 128 I get frequencies (they vary a little bit) around 8920 – 8936 Hz and with a 64 prescaler I get 17825 – 17793 Hz which confirms the data of the post.
The choice of your sampling frequency depends on your application. In my case, as I want to analyze audio signals and I am especially interested into low frequencies, I will be happy to use the standard setting, 9/10KHz of sampling freq, which leads to 5KHz analyzable spectrum. In fact, 5000Hz is much below the audible spectrum (around 15KHz) but it is still quite a high pitch note (you can use this web page to get an idea of how it sounds).
There are interesting projects that make us of higher sampling frequencies, for example, here or here.
A very cool and serious project is this one, which makes a complete digital signal processor out of an Arduino.
Analyzing the signal
The analysis of the signal depends on your application. You can go from very detailed frequency analysis to something very raw and simple.
Let’s see a couple of solutions:
FFT analysis
For sound analysis you can use a proper FFT or implement a FHT. A fast implementation of the FFT is available here also.
I have personally tried the FHT with the example sketch plus the PureData application it comes with and I have to say that I was amazed. I have been generating some tones with the online tone generator, passed them to the opamp circuit set to 50x gain, then fed to the Arduino in its analog pin 0. In the picture below you can see the FHT of a signal at 2000Hz.

FHT of a 2kHZ tone, amplified by the opamp circuit, computed in Arduino and shown in PureData
You can clearly see the peak at 2000Hz and also some harmonics, probably a consequence of the saturation.
Digital filters
If you need to detect only few bands, another possibility for sound analysis are FIR or IIR filters, creating one filter for each band you want to detect. There is a very useful online tool for designing FIR filters here. If the bands you want to analyse are several, this approach wouldn’t save you so much computation with respect to the FFT as you will have to make several multiplications for all of your weights in the filter (which can be many, depending on how complex the filter is).
Other simpler approaches are possible, but based on the same principle, like in this other example. Unfortunately the code is not well commented and I couldn’t understand well how it works, as far as I have understood he sums the samples in groupa of 2, 20 and 100. The more samples you add the lower the frequency, but then some magic happens and I get lost.

very interesting article!
thanks for sharing.
following you!
Hy guys, thank you for all that stuff, very good. I’ve one question anyway.
I use the FFT algorithm on my arduino kit and i’ve changed the speed of the serial moniteur to 115 200 because the code is using the serial with that speed. The problem is that data displayed is not understanding. Do you know what is wrong ?
Thank you for help,
Franck
Hi Franck,
I can’t help you if I don’t see the sketch. My approach didn’t use FFT to save computational time.
You can write me in pvt if you want.
Thanks a lot, can you give me your address please. Mine is
franck.copeland@gmail.com
If I were trying to find out the resonant frequency of glass. What prescaler would i use? The frequency shouldn’t be more than 2000 hz.
According to the Nyquist’s theorem you need to double the detectable frequency, that is: you need at least 4kHz, therefore whatever prescaler will be enough. But be careful: if you do any other computation while sampling you will reduce the sampling frequency significantly, so I would suggest to measure your actual sampling frequency once you have finished coding !
Ok Thanks
Hi…is it possible to “listen” with arduino a frecuency of 69 khz?
Nope, the maximum “listenable” frequency would be the half of the maximum sampling freq: 77KHz / 2 = 37.5 KHz.
Could you please send me your email? i have things to ask
why not here?
First thing is instead of the circuit you have provided, i brought LM358 module as shown in link. could you please check and let me know how to use this properly ?
I have no experience with this amplifier, but Dr. Google can always help. Like here: https://lowvoltage.wordpress.com/2011/05/21/lm358-mic-amp/
Could you please tell me how did you connect LM358 output to head phone?
Next can you tell me how did you analyzed “PureData application”. Inside the FHT library there’s example called fht_adc.pde file right? Is there any software we can analyzed ?